Real-time health insights, personalized to you
Show Them the Data
I started looking at the data.
For most of my life I thought I understood health the same way most people do. Eat reasonably well. Exercise a little. Try to do the right things and assume everything will probably work out.
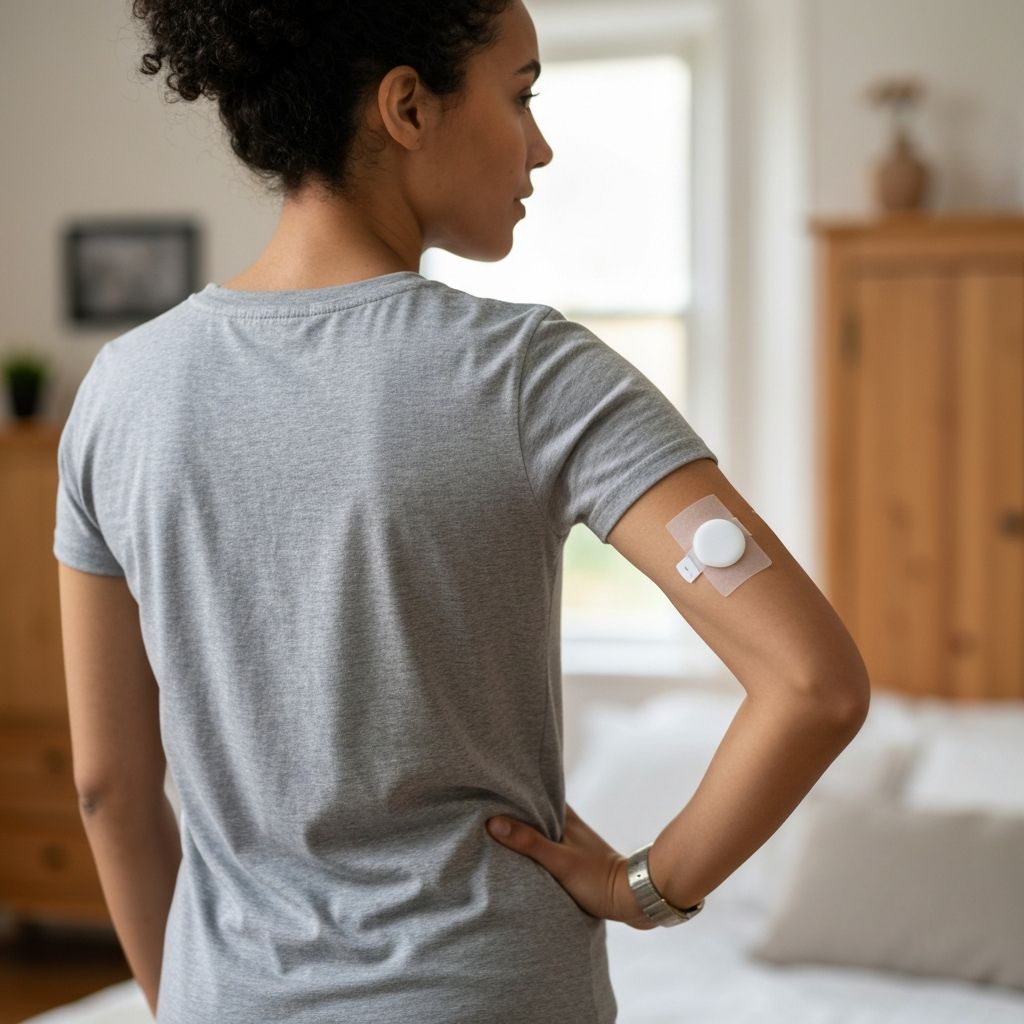
But when I started wearing a continuous glucose monitor and actually looked at what my body was doing in real time, it changed how I thought about health completely.
What changed
Am I hurting myself every morning while trying to eat healthy?
Many of us start the day thinking we are making a healthy choice. But when you can actually see how your body responds to food, sleep, stress, and everyday habits, the story can look very different. Sometimes the surprise is not junk food. Sometimes it is a meal that looks balanced, clean, and healthy on the surface.
Another important lesson learned!
Rice cake sandwich with spinach, egg, and salmon — now I know.
Glucose Impact
A meal I thought was healthy
The turning point
I realized most people never get to see this.
When I started sharing moments like this with friends and family, the reaction was almost always the same.
People would say things like "Wait, that food did that?" or "I had no idea your body could respond like that."
That is when it clicked for me. This information is incredibly powerful, but most people never get the chance to see it.
Show Them the Data started as a simple idea: what if more people could see what their own bodies are actually doing?
The idea
Data over opinions
Health conversations are full of opinions, diets, and conflicting advice. But biological data does not argue. It simply shows what is happening.
The mission
Help people see
This project exists to help people understand metabolic health by making biological feedback more visible, understandable, and accessible.
The long term goal
A movement
Over time, Show Them the Data aims to build a community around metabolic awareness, early detection, and better personal health decisions powered by real data.
Key metrics
Understanding your numbers at a glance.
These four metrics provide a quick snapshot of metabolic health. Each tells a different part of the story.
Average Glucose
Within optimal range
Time in Range
Target: 70-180 mg/dL
Estimated A1C
Non-diabetic range
Daily Variability
Standard deviation
What the data shows
Three charts that make the idea instantly clear.
These are illustrative examples for launch. Later, we can swap in real screenshots and real meal notes from your own CGM journey.
Chart 1
The breakfast surprise
A meal that looks healthy can still create a strong spike. This is the chart that makes people stop and rethink their assumptions.
Chart 2
Healthy vs healthy
Two breakfasts can both sound healthy on paper but create very different responses once the data is visible.
Chart 3
Sleep changes the baseline
It is not always just the food. Poor sleep can shift the starting point upward before breakfast even begins.
Food spike estimator
What is this food likely to do?
This is a great future feature. For launch, I added a simple demo version that gives people the idea. Later, we can make it smarter with serving size, protein pairing, time of day, and user-specific feedback.
Select a food item to see its estimated glucose spike potential
Estimated rating
9/10
Interpretation
High spike potential
Why this matters
See your metabolism in real time
Most people make daily decisions about food without ever seeing how their body actually responds. A continuous glucose monitor changes that. Instead of guessing, you can watch your metabolism react in real time. Meals that seem healthy may spike glucose far more than expected, while other foods barely move the needle. When people see their own data, the conversation about health changes from opinions and assumptions to something much more powerful — evidence.
Real stories
What people discover when they see their data.
These are real experiences from people who started tracking their glucose and made meaningful changes based on what they learned.
"I always thought oatmeal was healthy for me. Seeing my glucose spike to 156 after eating it completely changed my breakfast routine."
Sarah M.
CGM user for 6 months
Peak reduced by
42 mg/dL
"The sleep connection was eye-opening. I never knew poor sleep could raise my fasting glucose by 15-20 points before I even ate anything."
Michael R.
CGM user for 1 year
Fasting glucose improved
18 mg/dL
"My doctor told me I was pre-diabetic. After 3 months of CGM data, I learned exactly which foods worked for my body. My A1C dropped from 6.2 to 5.4."
Jennifer L.
CGM user for 8 months
A1C reduction
0.8%
FAQ
Common questions about glucose monitoring.
Understanding your metabolic health starts with understanding the basics. Here are answers to questions we hear most often.
Get Involved
Help us put data in more hands
There are many ways to support our mission of helping people understand their metabolic health through real data. Every contribution makes a difference.
Make a Donation
Your donation helps us provide continuous glucose monitors to individuals who want to understand their metabolic health but lack the resources.
Donate Supplies
Have unused CGM sensors or related supplies? We can connect them with people who need them. Every sensor makes a difference.
Volunteer Your Time
Help with outreach, education sessions, or community events. We're always looking for passionate people to spread the word.
Get in Touch
Have questions, ideas, or just want to learn more about what we do? Send us a message and we'll get back to you.
Prefer to reach out directly? Email us at info@showthemthedata.org
Stay informed on metabolic health.
Get updates on new research, CGM insights, and educational content delivered directly to your inbox. No spam, just data.
We respect your privacy. Unsubscribe at any time.
Join the project
Help more people understand what their own data is saying.
Donations and community support help fund education, outreach, and future programs that make metabolic health tools easier for more people to access and understand.